Emerging LED Technologies for Fluorescence Microscopy
Abstract
Fluorescence microscopy has employed mercury arc lamps for decades because of their high power and broad spectrum. Fluorophores and filter sets have been developed around the peaks of the spectrum offered by these lamps. When LEDs first entered the fluorescence microscopy arena, prices were high and output was low, but in recent years there have been significant advancements in LED capabilities for microscopy. This article aims to educate users of fluorescence microscopy about the benefits of LEDs compared to conventional mercury arc lamps.
Introduction
Fluorescence microscopy is a standard technique used in most laboratories around the world. With the discovery of fluorescence proteins such as green fluorescent protein (GFP), research publications using fluorescence techniques have skyrocketed. The conventional HBO® mercury short-arc lamp is a direct-current gas discharge lamp that has been standard in fluorescence microscopy for several decades. Routine imaging protocols, as well as fluorophore and filter development, were based on the spectrum of these lamps. In the early 2000s these lamps were replaced by pre-aligned lamps with less mercury content and a similar spectrum but were easier to install and offered longer lifetimes when compared with traditional mercury arc lamps. When LED (light-emitting diode) light sources for microscopy were first introduced in the mid-2000s prices were high and output was low, creating a poor initial impression of this technology in the microscopy industry. Within the last few years, LEDs have gained increasing popularity as higher-power LEDs are now available, a result of the influence of the general lighting and projection industries where LEDs are prevalent. The benefits of using LEDs in microscopy and imaging are addressed in this article for microscopists and instrumentation manufacturers alike.
Characteristics of LEDs
Advantages
An LED is a semiconductor device that emits photons when a voltage is applied. The device material determines the wavelength of emitted light. By adjusting the type and doping of the semiconductor material, many different wavelengths across the visible, UV, and IR spectrum can be produced. LEDs have several favorable characteristics compared to traditional mercury arc lamp systems. First, they emit a relatively narrow wavelength range (20–30 nm bandwidth), an advantage when paired with specific biomarkers. They can also be switched ON and OFF instantly, eliminating a rate-limiting mechanical shutter. The ability to adjust intensity by controlling voltage negates the need for an iris or neutral density filters. One of the most advantageous characteristics of the LED light source is its long lifetime with minimal decrease in total optical power over years of continuous operation. Additional advantages of LEDs compared to traditional mercury arc lamps may be summarized as follows: less maintenance (no bulbs to replace), lower electricity consumption, ability to select wavelengths of interest and avoid the harmful wavelengths from reaching your sample, higher signal-to-noise (S/N), instant on/off and variable intensity control, fewer microscope parts required (no shutter, no neutral density filters), and less mercury in the lab.
Why Use LEDs?
Manufacturers and design teams knowledgeable and experienced with LED technology can leverage the benefits of LEDs to design a robust and high-performing system with features not realized with traditional mercury arc lamp technology. The basic differences between lamp and LED are noted in Table 1.

LEDs are small, cool, and last forever
All are great reasons to have an LED flashlight on your keychain, but these are misconceptions when it comes to high-performance light sources for fluorescence microscopy. First, “LEDs are small.” Yes, the actual LEDs are tiny, but they must be packaged with electronics, lenses, and other components to drive them, focus the light, and dissipate heat. The resulting form factor is often comparable to a traditional light source and its power supply. Second, “LEDs are cool.” Yes, LEDs are cooler than the several hundred degrees of a mercury arc, but that does not mean they generate no heat. Although LEDs are more efficient in converting energy into light, to achieve the intensities required for fluorescence microscopy applications, LEDs are driven at high currents. This generates enough heat to detrimentally affect the stability and lifetime of the LEDs unless appropriate thermal management systems are in place. Third, “LEDs last forever.” Depending on the LED, lifetimes vary from 10,000 to over 50,000 hours. This is true as long as the LED is well managed thermally. LEDs are very heat-sensitive compared to arc lamps, so driving an LED too hard (that is, at high current) can increase the light output to make it brighter, but this also causes the output intensity to degrade over time and decreases LED lifetime if thermal management is not ideal. Also keep in mind that while LEDs are the heart of the light source, a long lifetime won’t mean anything if the supporting electronics, optics, and other components are not equally robust.
Effect of LEDs on biological cells
Early studies have found that live cultured cells prefer pulsed LEDs rather than continuous illumination (Figure 1). In a study by Feng et al. cells were exposed to the same dose of total light. The cells exposed to continuous illumination had over twice the staining of a phototoxicity indicator compared to cells exposed to pulsed illumination. In another study, cells imaged with LEDs appear to proliferate more than those imaged with a mercury arc lamp
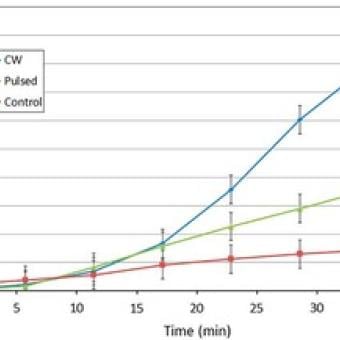
Figure 1
Integrated optical density (IOD) of the MitoSOX phototoxicity indicator as a function of time over a 40-minute period, in cells subjected to continuous wave (CW) LED illumination, pulsed LED illumination, and no illumination (control). The IOD is the area of the MitoSOX signal multiplied by the intensity. The data points are the average of 8 fields of view, and the error bars are an estimate of the standard error.
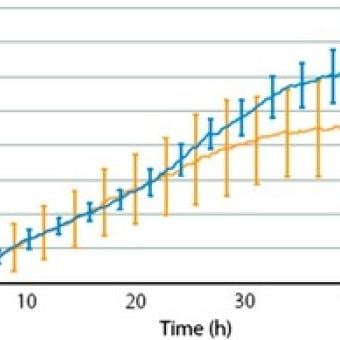
Figure 2
HeLa cell proliferation when imaged with an LED fluorescence illuminator (blue) vs. traditional HBO mercury arc lamp (orange). Error bars represent standard deviation. The light intensity was set up to have the same excitation power for both the LED source and HBO. To avoid bleaching of the non-imaged part of the sample, field stop was set to limit camera field of view
Stability and repeatability
An inherent property of LEDs is that the optical power peaks when first turned on. As the temperature of the LED junction heats up and reaches equilibrium, the LED wavelength and optical power stabilize. It takes a few seconds to reach thermal equilibrium, and after this time, an LED system with a robust cooling system will typically become stable in the millisecond timeframe every time the LED is switched on (Figure 3). It is important to understand that the variation in optical power at start-up can be minimized and reduced by adopting advanced thermal management strategies at the device and system level (Figure 4). Poor thermal management will also shorten the lifetime of the LED.
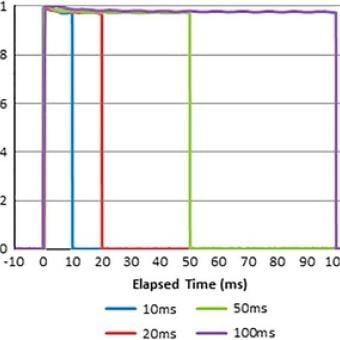
Figure 3
LED stability. Relative intensity of LED over several typical exposure times. Stability after the initial spike is within 1%.
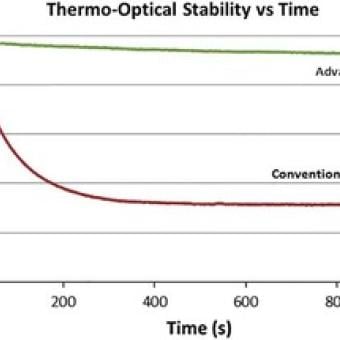
Figure 4
Importance of thermal management in the LED system design. The magnitude of drop in intensity from when the LED is ON relates to the efficiency of thermal management. The red graph line depicts a poorly controlled system with a large drop in intensity. The green graph line depicts a thermally well-managed unit with lower intensity drop.
The key to selecting an LED illumination system is to ensure that every time the LED is switched on, the dose of light delivered to the sample is repeatable. LEDs need not be used as lamps where the light source remains ON and the light is physically shuttered. The ability of LEDs to be turned ON and OFF rapidly allows for light to be ON only when the camera is exposing. This results in less light exposure to cells, thereby causing less photo bleaching and phototoxicity. As long as every time the LED is switched ON and delivers the same dose of light to the sample being studied, the data produced from these exposures can be trusted for quantitative analysis
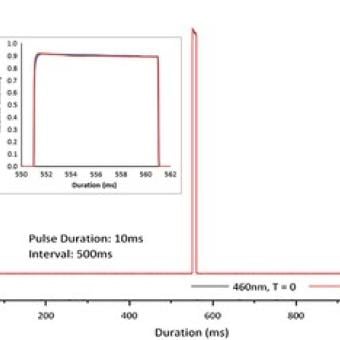
Figure 5
LED repeatability. LED was pulsed for 10 ms ON, 500 ms OFF, repeated over 10 minutes. The inset graph shows each peak overlaid to show the area under the curve (i.e., the amount of light the sample is exposed to) is repeatable every time.
The LED “Green Gap” Challenge
For years the spectral properties of the mercury arc lamp have defined the chemistry of fluorophores, as well as the excitation and emission filters used in biological imaging. The mercury arc lamp has specific peaks in optical power around which the most common fluorophores such as DAPI, FITC, and TRITC have been developed and used for decades. With technology moving to LEDs, users must be aware that LED peaks may be different from the absorption spectrum of their fluorophores, and optimizing their filter choices to the LED spectrum is key to efficiently excite the fluorophores being used.
Difficult wavelength range
The challenge faced by manufacturers is to design systems that cover the same portion of the spectrum as the mercury arc lamp to adequately excite the common fluorophores used in fluorescence studies. The most challenging wavelength band to match has been between 540–590 nm, known in the solid state lighting industry as the “green gap.” Emission in this region of the spectrum is fundamentally limited by the lack of semiconductor materials to efficiently emit light at this wavelength. LED manufacturers for microscopy and fluorescence excitation have struggled with this for many years, and some have generated innovative solutions to bridge the gap. A range of solutions with varying degrees of success are now available including LED arrays and wavelength conversion technology such as phosphor materials combined with LEDs, while others rely on lasers or even mercury arc lamps to excite fluorophores efficiently at these wavelengths.
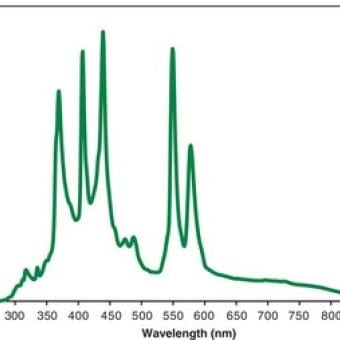
Figure 7
Spectrum of a multi-wavelength LED system. The 575 nm wavelength is generated using laser phosphor technology and fills the “green gap.”
Filling the gap with combined technologies
Whereas production of LED sources in the “green gap” is limited by the lack of available semiconductor materials to produce light at these wavelengths, wavelength conversion using phosphor materials has long been used in the lighting industry. Shorter wavelength light (that is, blue, violet, UV) is absorbed by a material (layer, suspension, or ceramic) that re-emits light of a longer wavelength. To successfully take advantage of this phenomenon, the system manufacturer must be knowledgeable of all thermal, electrical, and optical parameters that affect the overall conversion efficiency and subsequent collection of light. Efficient coupling of light to the microscope is often overlooked but can have a significant impact on the overall efficiency and performance of the system.
By combining LED, laser, and phosphor technologies with collection optics, a suitable scheme can be used to overcome the wavelength gap and produce an optical spectrum that meets the microscopy industry’s needs while no laser light actually leaves the system enclosure. Such an optical system can be optimized for superior illumination uniformity and maximum light delivery at all wavelengths for improved qualitative and quantitative analysis. This helps efficiently generate high-power light to fill in the “green gap,” enabling users to excite fluorophores or fluorescent proteins such as mCherry, which is commonly used in fluorescence detection and imaging applications.
Which Technology is Right for Me?
LED options
Typical LED options available today include the following three: (a) “White broadband” LED sources. These are broadband sources with wavelengths ranging from near-UV all the way to near-IR. The light emitted looks “white” to the user, and all this light is delivered into the microscope system, similar to a mercury arc lamp. For excitation of specific fluorophores, the light needs to be filtered through filter cubes in the microscope. (b) Multi-wavelength sources. Multi-wavelength LED systems contain from two to seven distinct LEDs (or phosphor-generated wavelengths). LEDs are either combined into one emission leading to a “white broadband” source or can be selected separately. The advantage of using selectable LEDs is longer life because not all LEDs are being used all the time. Another reason to use this system is the ability to quickly switch between wavelengths. Because LEDs can be rapidly switched ON and OFF, and can also be filtered at the source, the only requirement in the microscope filter turret is for dichroics and emission filters. If these can be combined for several wavelengths, the user can design a multi-band dichroic and emitter in order to accommodate all colors being imaged in one filter cube. This method allows for fast imaging of different colors without having to wait for a filter change in the microscope. (c) Single-wavelength LEDs. If a user has only one fluorophore to be excited, a single LED is a good choice. These are smaller than multi-wavelength units and easy to install, with all the benefits of LEDs at the specific wavelength required. The downside is that there is no room for expansion if the user changes his/her protocol to add another fluorophore.
Important factors to consider
For an end user, important questions to answer that will determine which light source is right for a particular fluorescence application include the following:
- What fluorophores need to be excited?
- Can I directly couple into my system, or do I need a fiber?
- Do I need fast switching between colors, or can I rely on the switching speed of a filter wheel?
- Is my lab moving to mercury-free technologies?
For an OEM integrator, the same questions apply, but some additional factors must be considered including: - Footprint – The light source needs to physically fit into the system being built.
- Thermal Management – If the light source is inside in a larger enclosure, care must be taken to work with the airflow in order to avoid over-heating issues, which can lead to LED failures, reduction of lifetime, and degraded performance.
- Coupling – Depending on the architecture of the final unit, the light source will need optics and adaptors to fit into the optical path of the integrator’s system.
Discussion
Despite the many advantages of LEDs in microscopy, mercury arc lamps still have a place until LED technology can fully replace the traditional illumination source. Mercury arc lamps are still brighter at some wavelengths, for example, in cases where fluorescence excitation under 340 nm is required. Unfortunately, demand for LEDs at these wavelengths is low in large industries such as general lighting and projection. These markets force manufacturers to create cheaper and more effective solutions to compete for these much larger businesses. Our microscopy industry is only a tiny drop in this massive ocean. In order for microscopists to have an affordable solution for our needs, we currently must accept the technology developed for the lighting giants and use our ingenuity to create useful systems for microscopy.
Conclusion
Commercial LEDs have gained popularity in our homes and are starting to migrate into research and hospital laboratories. With their ease of use, long lifetimes, and low waste, they will continue to take over the role of the traditional mercury arc lamp.